
Important updates about the attribution window in Google Analytics App + Web properties
On Monday, June 29, Google began make changes to the infrastructure that powers attribution reporting in Google Analytics App + Web properties. The official statement says that a new infrastructure will support more robust attribution features and services including more diversified data sources, models and identity methods. For now it is hard to say what exactly it means, but we will continue to follow this topic.
Currently the attribution window for all re-engagement conversions in App + Web properties is set to 180 days. As part of the infrastructure migration Google will be changing this attribution window for all re-engagement conversions from 180 days to 90 days. This change could result in more conversions being attributed to a “direct” source in reporting for some advertisers but the impact will be minimal for most.
Filter charts by metric values in Google Data Studio
We waited a very long time for this feature, but from June 18 you can finally add a metric slider control to your charts in Google Data Studio. As you can see, the using is really intuitive for every users, even if you are not very familiar with computer work. The small disadvantage of this feature is, that a chart can have metric sliders or optional metrics, but not both.
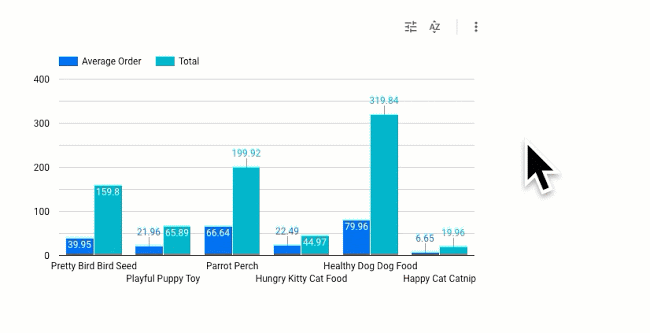
Read more: Google Support
Audience limit for App + Web properties increased from 50 to 100
One of the biggest disadvatage of Google Analytics App + Web are current collection and configuration limits – limits for number of events, audiences, registered numeric parameters or custom conversion events. For this reason the App + Web is not applicable for huge implementations.
The positive facts is that Google is gradually increasing the limits of key parameters in App + Web, for example as the latest increase of the maximum number of audiences from 50 to 100. We firmly believe that the trend of increasing limits will continue.
Read more: Google Support
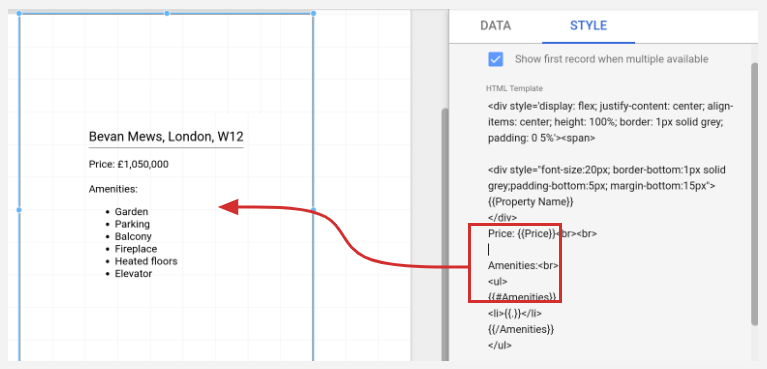
HTML in Google Data Studiu? Why not!
From time to time, a very interesting element will appear in Community Visualizations. Some of them could be even better as standard functions of Data Studio. Templated Record widget created by Romain Vialard is definitely one of them. Let’s see Romain’s LinkedIn, he has published several interesting widgets.
So, how the Templated Record can help you? This widget allows you to insert HTML code (including CSS) into your Data Studio report and combine the HTML code with metrics and dimensions in very simple way. We at DASE definitely fell in love with this extension. What about you?
Read more: Google Data Studio / Templated Record