Obsah článku
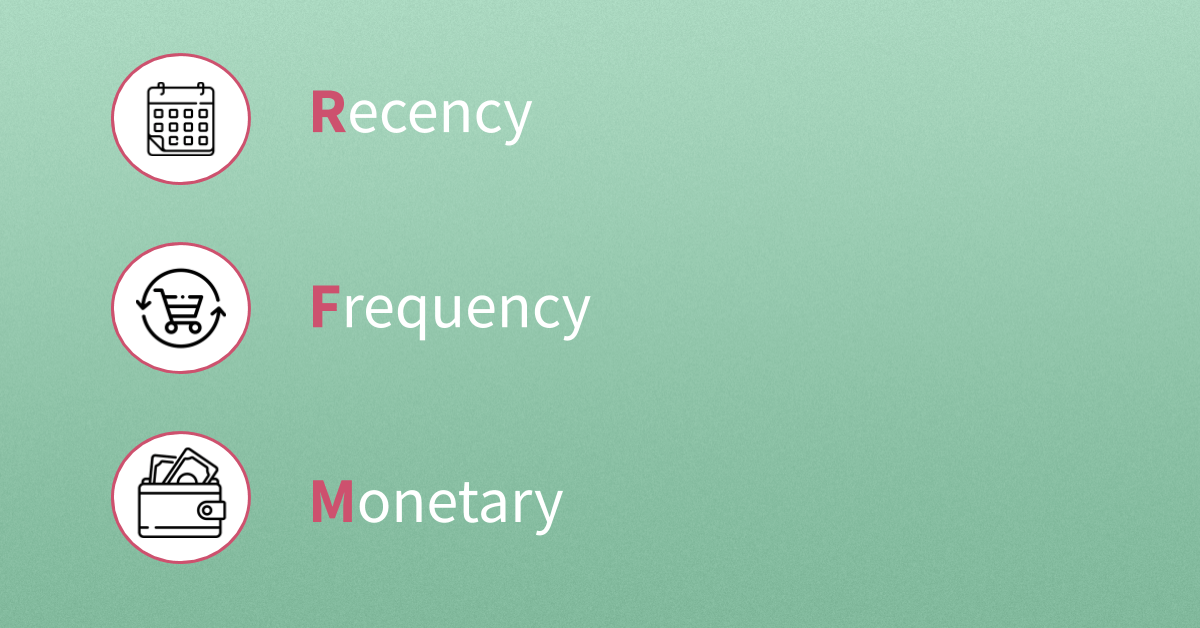
RFM (Recency, Frequency, Monetary) analysis is an easy way to divide customers into segments based on their purchasing behavior. This analysis has been used for more than 25 years to improve targeting, reduce costs, and increase the return on advertising investment.
History of RFM Analysis
The RFM analysis was used for the first time in the USA by mail order companies focused on catalogue sales, such as Land ‘s End, Charles Tyrwhitt or JCPenney. They used it to minimize shipping costs and maximize profits from sales. Thanks to the analysis, they were able to identify customers to whom they didn’t need to send catalogues or offer various discounts anymore.
The effectiveness of RFM analysis is also confirmed by the following practical examples:
- Eastwood increased email marketing profits by 21 % (2008).
- L’Occitane received 25 times more revenue from email marketing.
- Frederick’s of Hollywood increased conversions by 6-9 %.
You can read more in the study from Winston Circle.
Customer Segmentation
The result of RFM analysis is usually the division of customers into segments. The number of segments depends on you, but 11 segments are the most often used. The table provides an overview of the segments together with their definition and suitable recommendations.
| Customer Segment | Activity | Actionable Tip |
| Champions | Bought recently, buy often and spend the most! | Reward them. They can be early adopters for new products. Will promote your brand. |
| Loyal Customers | Often spend good money buying your products. Responsive to promotions. | Upsell higher value products. Ask for reviews. Engage them. |
| Potential Loyalist | Recent customers, but spent a good amount and bought more than once. | Offer membership/loyalty programs and recommend other products. |
| Recent Customers | Recent shoppers, but haven’t spent much. | Provide onboarding support, give them early success, and start building relationships. |
| Promising | Bought most recently, but not often. | Create brand awareness, offer free trials. |
| Customers Needing Attention | Above-average recency, frequency and monetary values. They may not have bought very recently though. | Make limited-time offers. Recommendations based on past purchases. Reactivate them. |
| About To Sleep | Below average recency, frequency, and monetary values. Will lose them if not reactivated. | Share valuable resources. Recommend popular products/renewals at discount. Reconnect with them. |
| At Risk | They spent big money and purchased often. But the last purchase was a long time ago. Need to bring them back! | Send personalized emails to reconnect, offer renewals, provide helpful resources. |
| Can’t Lose Them | Often made the biggest purchases but they haven’t returned for a long time. | Win them back via renewals or newer products. Don’t lose them to competition, talk to them. |
| Hibernating | The last purchase was long ago. Low spenders with a low number of orders. | Offer other relevant products and special discounts. Recreate brand value. |
| Lost | Lowest recency, frequency, and monetary scores. | Revive interest with a reach-out campaign, ignore otherwise. |
Why RFM Analysis
With RFM analysis, you can find answers to questions such as:
- Who are your best and the most loyal customers and how to keep them?
- Which customers are close to leaving you?
- How to increase the frequency of recurring purchases?
- What to communicate to individual customer segments?
- How to increase the likelihood of recurring purchases for new customers?
The main principle used in RFM analysis is the Pareto principle. So focus on important customer segments that are likely to give you a higher return on investment.
I hope you are now convinced of the usefulness of the RFM analysis for your own business.
Basic Calculations
For calculations, you will need the following information about each customer:
- Customer ID (email, user ID, client ID, name, etc.) so you can identify each customer.
- Recency (R): How many days, weeks, months have passed since their last purchase? To calculate the current value, simply subtract the date of the last purchase from today.
- Frequency (F): How many times has a customer bought from you? For example, if someone has bought 10 times from you in a certain period of time, their frequency will be 10.
- Monetary (M): How much money did the customer spend? If someone bought products or services a total of € 1,000 from you for the selected period, then this value will be € 1,000.
Example of sample data
We will use data from Google Analytics for our calculations, where you can send a client ID to your own dimension as a customer identifier.
In our case, the transaction represents the reading of the article to the end and the revenue represents the number of words in the article that the user read on our blog.
| Client ID | Date | Transactions | Revenue |
| 100438314.1556 | 2019-05-02 | 2 | 1750 |
| 100515227.1557 | 2019-05-02 | 3 | 2297 |
| 1006060326.1564 | 2019-08-28 | 2 | 2916 |
| 1010126481.1552 | 2019-04-05 | 2 | 2308 |
| 101406401.1571 | 2020-03-20 | 2 | 4590 |
| 1027069711.1550 | 2019-04-17 | 2 | 1812 |
| 1046122396.1556 | 2019-04-21 | 2 | 1460 |
| 1047540009.1561 | 2019-06-24 | 2 | 1790 |
| 1049573649.1575 | 2020-01-08 | 2 | 1806 |
| 1064248633.1569 | 2019-09-18 | 5 | 5205 |
| 1075101880.1572 | 2019-10-25 | 2 | 2377 |
Calculation of Recency, Frequency, and Monetary values
From the data above, you can calculate the following information in Google Sheets:
- Date of first transaction (MIN function)
- Date of last transaction (MAX function)
- Number of months since last purchase (DATEDIF)
- Average Order Value (SUMIF)
- Average order frequency (number of transactions)
To make your data more realistic, you can use the frequency of orders per day, month, or year. You can choose a time period that makes sense for your business. For example, if you sell coffee, it will be appropriate to use days, if cars, it would be more reasonable to choose, for example, the year.
Note: When calculating, it doesn’t matter if you focus on the average order value per month, year, or day, because you’ll then calculate an RFM score on a scale of 1-5 using a percentile for each customer.
How to calculate the RFM scores on a scale from 1 to 5?
You can calculate these values in several ways. One way is to use an estimate when you look at the results and say that all customers who have bought from you within 30 days, will have a score for recency (R) 5.
However, I recommend that you use quantiles to calculate the RFM score. The quantiles are like a percentile, but instead of dividing the data into 100 parts, it divides them into 5 equal parts. This method is a bit more complicated to calculate, but you can apply it to any industry. Its advantage is that it distributes customers evenly to all quantiles.
In the next step, you need to sort your customers by using the RANK function. Use this feature to assign a score to each customer, which you use later to calculate percentiles.
After sorting, you need to calculate the percentiles in the help table, according to which you assign the RFM score. To do this, use the PERCENTILE function. With it, you get values based on which you can divide customers into 5 equal groups (quantiles).
Based on the percentile, you assign an RFM score to each customer using the IF function based on their rank. So if the customer’s rank for recency is higher than 255.4, then this customer is among the top 20 % of customers by recency.
As a result, you get each customer’s score for recency, frequency, and monetary.
Customers who are frequent buyers, have recently bought from you and usually are spending a lot of money, they would get a score of 555: Recency (R) – 5, Frequency (F) – 5, Monetary (M) – 5. They are your best customers.
On the other hand, customers who spend the least, do almost no buying at all and their last purchase was really long time ago, they will get a score of 111: Recency (R) – 1, Frequency (F) – 1, Monetary (M) – 1.
That makes sense. Right?
Grouping customers into segments (clusters)
R, F, and M have scores from 1 to 5, so there are a total of 5 x 5 x 5 = 125 combinations of RFM values. If you want to see how many customers you have for each RFM value, you would need to look at 125 separate segments.
Having high granularity in data may not make sense for many companies, so you can summarize the analysis into 11 segments to better understand your customers. I mentioned these segments at the beginning of this article.
Here’s a table that explains how you can create 11 segments based on an RFM score.
| Segment | Scores |
| Champions | 555, 554, 544, 545, 454, 455, 445 |
| Loyal Customers | 543, 444, 435, 355, 354, 345, 344, 335 |
| Potential Loyalist | 553, 551,552, 541, 542, 533, 532, 531, 452, 451, 442, 441, 431, 453, 433, 432, 423, 353, 352, 351, 342, 341, 333, 323 |
| Recent Customers | 512, 511, 422, 421, 412, 411, 311 |
| Promising | 525, 524, 523, 522, 521, 515, 514, 513, 425, 424, 413,414, 415, 315, 314, 313 |
| Customers Needing Attention | 535, 534, 443, 434, 343, 334, 325, 324 |
| About To Sleep | 331, 321, 312, 221, 213 |
| At Risk | 255, 254, 245, 244, 253, 252, 243, 242, 235, 234, 225, 224, 153, 152, 145, 143, 142, 135, 134, 133, 125, 124 |
| Can’t Lose Them | 155, 154, 144, 214,215,115, 114, 113 |
| Hibernating | 332, 322, 231, 241, 251, 233, 232, 223, 222, 132, 123, 122, 212, 211 |
| Lost | 111, 112, 121, 131,141,151 |
Visualization of RFM analysis results
The graphical representation will help you to orientate faster and easier in the results of RFM analysis. When visualizing, it is good to use simple bar graphs, which will show you the distribution of customers in individual segments. You can also add average RFM values for each segment, individual recommendations for specific segments, and detailed RFM reports for each customer.
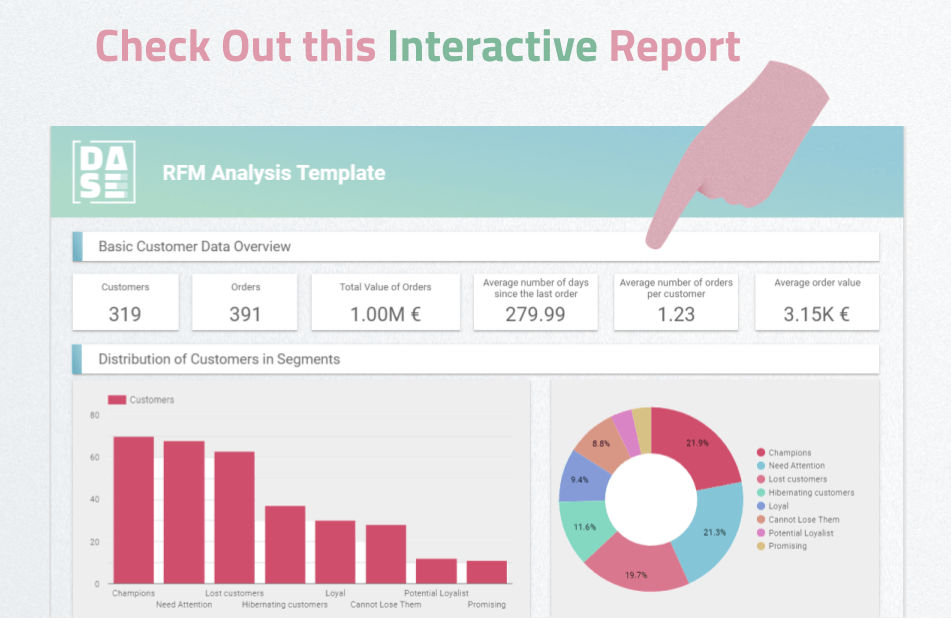
Example of visualization of RFM analysis results in Google Data Studio
Useful Recommendations
If you are interested in which channel brings the most VIP customers to you, you can upload the results of the RFM analysis to Google Analytics via the data import feature. Then, you can target these customers with customized advertising and with a high probability of reducing costs and increasing returns.
If you use emails for RFM analysis you can import these emails into the ad platform and target users who are similar to your VIP customers or exclude customers who belong to the lost segment from advertising.
Conclusion
It is nice to read the article, but the important thing is to use this RFM analysis and its results in practice.
Sign up for the newsletter and we will send you detailed recommendations on how to import email addresses into advertising platforms such as Google Ads, Facebook Ads, Linkedin Ads, or Twitter Ads.
If you like the article, I’d love it if you could share it with your colleagues and friends.